01
Staff to the traffic
See when people actually arrive rather than only when they buy, and roster against the busy hours instead of against the takings.

Connect a Dor people-counting account and your sales reports gain foot traffic, conversion rate, and average transaction value beside the revenue you already track.
Requires a Dor account and sensor. Connect it under Config → Dor Foot Traffic, then link each location that has a sensor.
Sales alone cannot tell you whether nobody came in, or plenty of people came in and left empty-handed. The first is a marketing problem. The second is a staffing, pricing, or merchandising one.
See when people actually arrive rather than only when they buy, and roster against the busy hours instead of against the takings.
A store on a quiet street and one on a high street can finally be judged on conversion rather than on raw revenue.
A promotion that lifts footfall but not conversion is a different result from one that lifts both, and the two are worth telling apart.
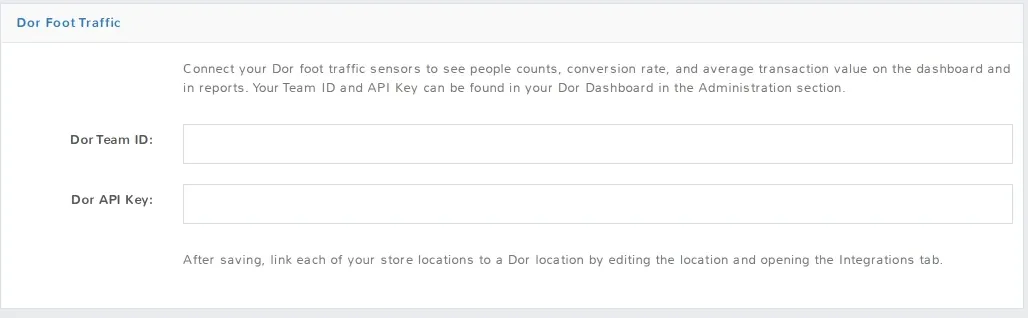
The integration needs your Dor Team ID and API key, both found in the Administration section of your Dor dashboard. After that you link each store location to its Dor location.
Open Config → Dor Foot Traffic, paste in the Team ID and API Key from your Dor dashboard, and save.
Edit each location that has a sensor and open its Integrations tab to point it at the matching Dor location. Locations without one are left unlinked and behave exactly as before.
Once Dor has synced data for those locations, the new report columns and the dashboard widget appear on their own.
There is no separate Dor report to learn. The traffic figures are added as extra columns to reports you use today, plus one widget on the dashboard.
Foot traffic, transactions, revenue, conversion rate, and ATV join the summary you already run for a period.
Turn on List Each Location Separately in Summary Reports and the same columns break out per location, which is where comparing conversion between stores gets interesting.
Traffic figures line up beside journal activity for the same period, so a busy day has context.
A Foot Traffic (Dor) — Last 7 Days widget shows traffic, transactions, revenue, conversion rate and ATV for the location you are signed in to, without opening a report at all.
Note: the columns stay hidden until Dor has actually synced data for the locations in the report. Configuring the integration on its own is not enough.
Related: Dor foot traffic in the Help Center, or see every reporting feature.
Start a free trial, connect your Dor account under Config → Dor Foot Traffic, and let the reports you already run answer a question they never could before.
See it in action
Over a hundred reports, filters that actually narrow things down, and period comparison — so you can tell which category paid the rent.
